MAYVILLE – The number of COVID-19 patients in Chautauqua County hospitals continued to decline on Thursday.
That’s per the county Health Department’s COVID-19 Dashboard.
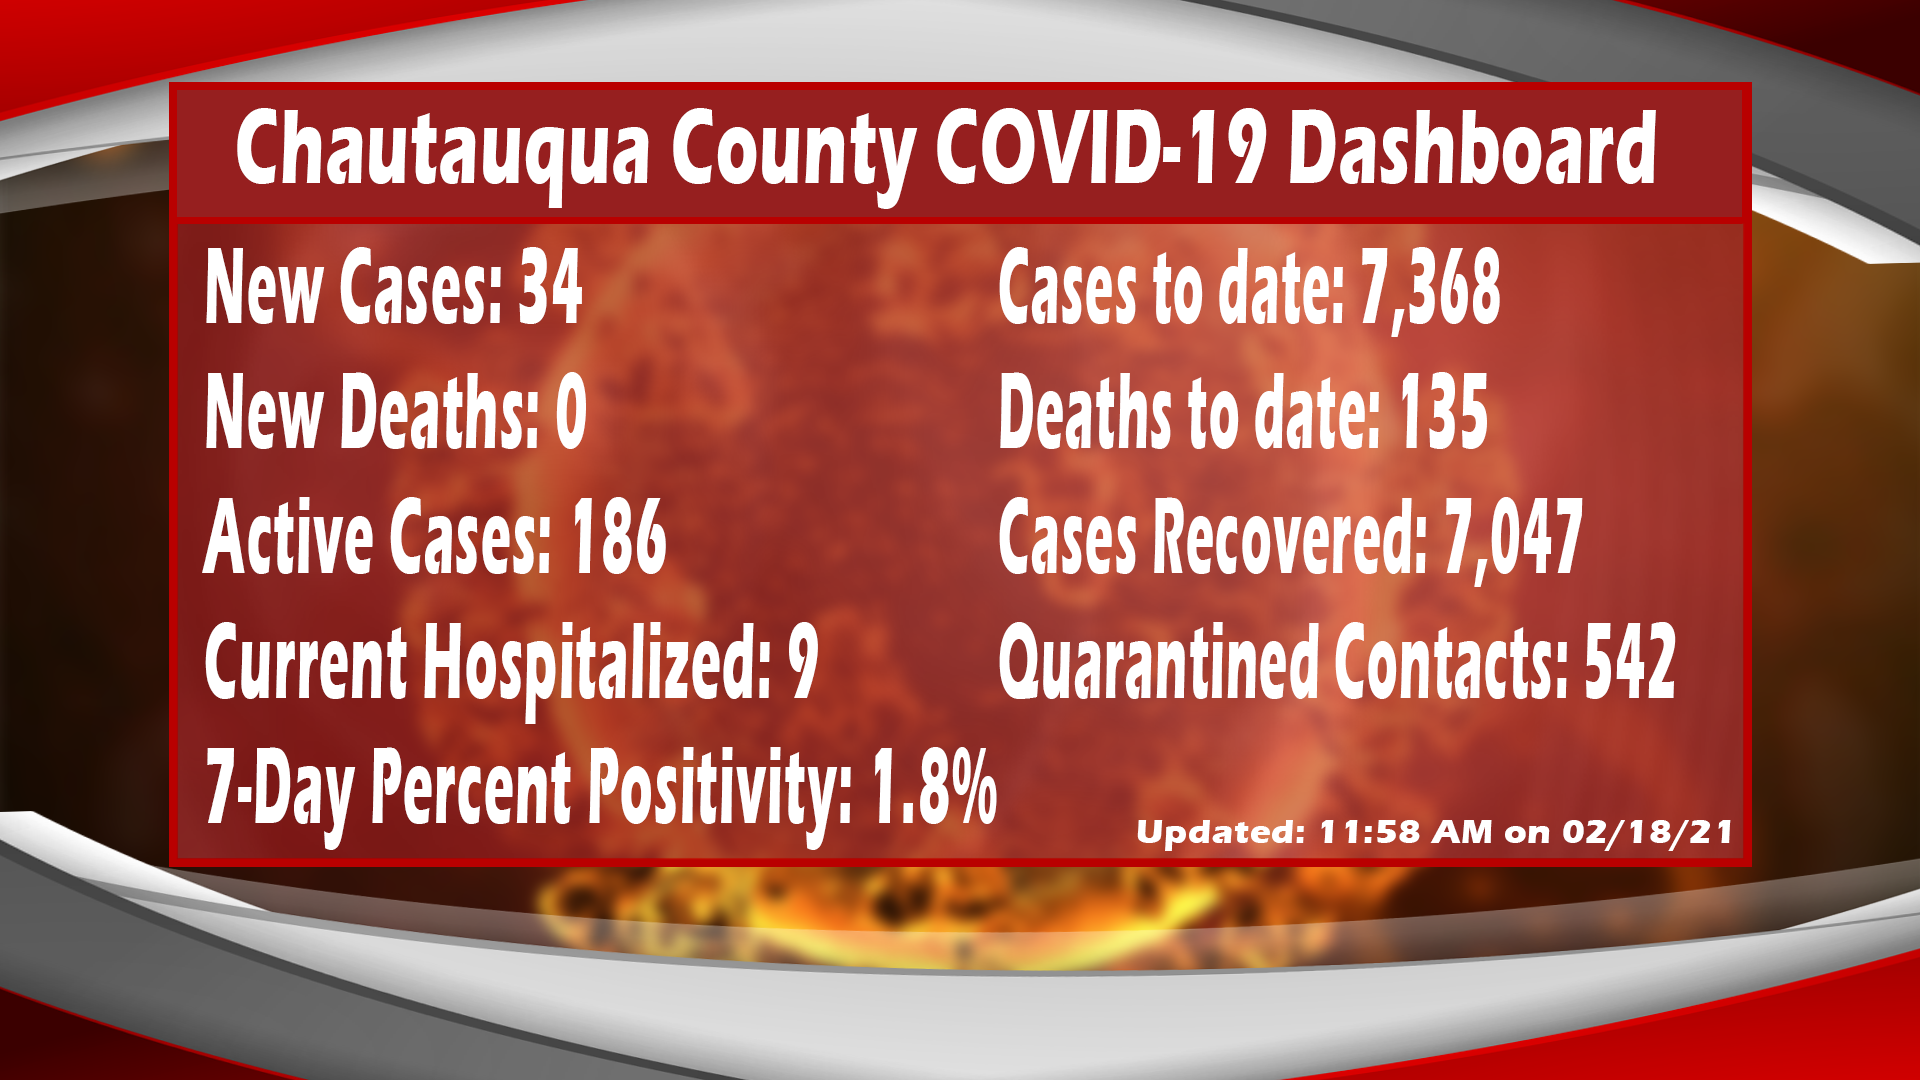
Leaders say 9 people are hospitalized, down from 13 the day before.
Thirty-four new cases of the virus were reported, with 186 cases now active countywide; slightly up from 181.
The seven-day average percent positivity rate is now 1.8 percent.
To date, 7,368 cases have been recorded with 7,047 people recovering and 135 related deaths.
More information on the update is posted below:
Doses of COVID-19 Vaccine Administered to Chautauqua County Residents
| First Dose | Second Dose | |
| Number of Doses | 11457 | 5604 |
| Percent of County Residents Ages 16+ | 10.95% | 5.35% |
| Percent of Total County Residents | 8.84% | 4.32% |
Preliminary data through 2/13/2021; subject to change as facilities correct data as needed. These numbers will be updated on a weekly basis, depending on the availability of NYS reports.
COVID-19 Cases by ZIP Code of Residence
*Please note that it is no longer feasible to report active cases by ZIP code on a daily basis. New and total cases, as well as a daily case rate will continue to be included on the dashboard. COVID-19 is widespread in Chautauqua County; precautions must be taken in all areas in order to reduce the spread of this disease.
| Zip Code | New Cases | Daily Case Rate per 100,000 residents | Total Cases | Percent of Total Cases |
| 14048- Dunkirk | 3 | 21.2 | 1355 | 18.4% |
| 14062- Forestville | 0 | 0.0 | 184 | 2.5% |
| 14063- Fredonia | 1 | 6.8 | 880 | 11.9% |
| 14081- Irving | 0 | 0.0 | 56 | 0.8% |
| 14136- Silver Creek | 2 | 43.9 | 274 | 3.7% |
| 14138- South Dayton | 0 | 0.0 | 28 | 0.4% |
| 14701- Jamestown | 19 | 47.8 | 1906 | 25.9% |
| 14710- Ashville | 1 | 30.6 | 147 | 2.0% |
| 14712- Bemus Point | 1 | 31.5 | 257 | 3.5% |
| 14716- Brocton | 1 | 36.4 | 199 | 2.7% |
| 14718- Cassadaga | 0 | 0.0 | 58 | 0.8% |
| 14720- Celoron | 0 | 0.0 | 28 | 0.4% |
| 14722- Chautauqua | 0 | 0.0 | 3 | 0.0% |
| 14723- Cherry Creek | 0 | 0.0 | 50 | 0.7% |
| 14724- Clymer | 0 | 0.0 | 112 | 1.5% |
| 14726- Conewango Valley | 0 | 0.0 | 17 | 0.2% |
| 14728- Dewittville | 0 | 0.0 | 40 | 0.5% |
| 14733- Falconer | 1 | 26.0 | 170 | 2.3% |
| 14736- Findley Lake | 0 | 0.0 | 17 | 0.2% |
| 14738- Frewsburg | 1 | 30.8 | 223 | 3.0% |
| 14740- Gerry | 0 | 0.0 | 65 | 0.9% |
| 14747- Kennedy | 0 | 0.0 | 99 | 1.3% |
| 14750- Lakewood | 1 | 22.3 | 296 | 4.0% |
| 14757- Mayville | 1 | 30.3 | 214 | 2.9% |
| 14767- Panama | 0 | 0.0 | 47 | 0.6% |
| 14769- Portland | 0 | 0.0 | 47 | 0.6% |
| 14775- Ripley | 0 | 0.0 | 106 | 1.4% |
| 14781- Sherman | 0 | 0.0 | 89 | 1.2% |
| 14782- Sinclairville | 2 | 82.1 | 95 | 1.3% |
| 14784- Stockton | 0 | 0.0 | 52 | 0.7% |
| 14787- Westfield | 0 | 0.0 | 254 | 3.4% |
| Total | 34 | 26.2 | 7368 | 100.0% |
COVID-19 Cases by Known Age
| Age Group | Total Deaths | Fatality Rate |
| All Ages | 135 | 1.83% |
| 0-39 | 0 | 0.00% |
| 40-49 | 4 | 0.41% |
| 50-59 | 4 | 0.38% |
| 60-69 | 11 | 1.22% |
| 70-79 | 29 | 6.07% |
| 80-89 | 52 | 16.77% |
| 90+ | 35 | 23.33% |
COVID-19 Cases by Presence of Symptoms at Time of Interview
| Symptoms | Number | Percent |
| Yes | 4157 | 73.89% |
| No | 1469 | 26.11% |
| Symptoms Known | 5626 |
Fatality Rate by Age Group
| Age Group | Total Deaths | Fatality Rate |
| All Ages | 135 | 1.83% |
| 0-39 | 0 | 0.00% |
| 40-49 | 4 | 0.41% |
| 50-59 | 4 | 0.38% |
| 60-69 | 11 | 1.22% |
| 70-79 | 29 | 6.07% |
| 80-89 | 52 | 16.77% |
| 90+ | 35 | 23.33% |
NYS Fatality Rate: 3.01%
US Fatality Rate: 1.7%
Source: Johns Hopkins University COVID-19 Tracker 2/11/2021


Leave a Reply