Every day in the United States, more than 100 people die in traffic crashes. Most Americans assume the roads are safer than they were a decade ago. The data tells a more complicated story.
NHTSA estimated 39,345 traffic fatalities in 2024, a decrease of 3.8 percent from the 40,901 fatalities reported in 2023. That decline is real and meaningful. But total road fatalities remain significantly higher than a decade ago, and America’s traffic fatality rate remains high relative to many peer nations. The improvement is happening unevenly across the country. Some cities are getting measurably safer. Others are not.
Understanding where the deadliest intersections and corridors are located matters for anyone who drives regularly. It matters even more for the families of victims trying to understand what went wrong and whether anything could have prevented it.
Where do most fatal crashes happen in American cities?
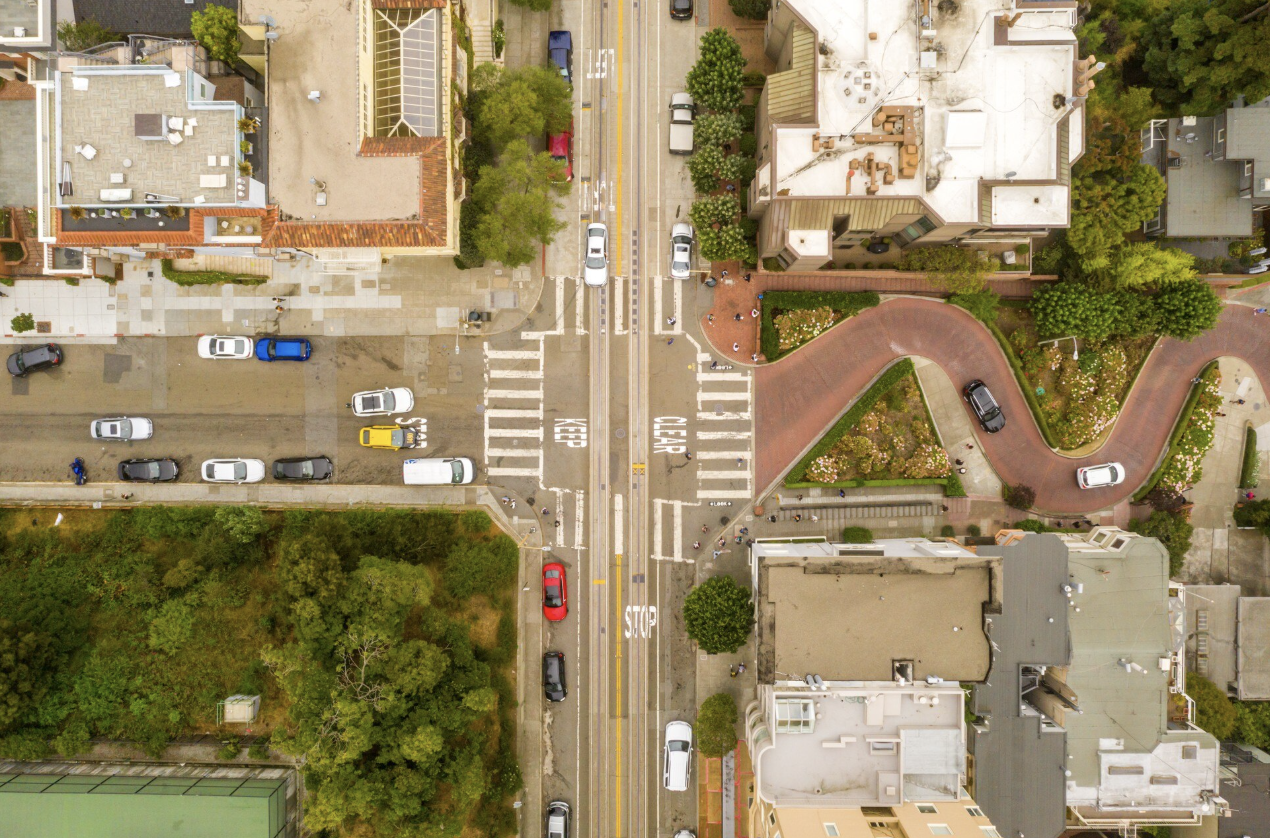
Intersections are the deadliest points on any urban road network. In 2023, there were 11,843 fatalities in intersection crashes across the United States. Of these, 73 percent occurred in urban areas.
The concentration of fatal crashes at urban intersections reflects several factors operating simultaneously. Speed differentials between crossing traffic streams create high-energy impact scenarios. Multiple turning movements increase the number of conflict points per vehicle trip. Pedestrian crossing activity raises the exposure of vulnerable road users to fast-moving traffic. Signal timing failures, limited sight lines, and driver distraction all compound at the same chokepoint.
The fatality rate per 100 million vehicle miles traveled decreased to 1.20 in 2024, the lowest since 2019. That rate improvement is driven largely by safety improvements on rural roads. Urban intersection fatality rates have proven more resistant to improvement, partly because the volume of conflict points increases as cities grow and traffic density rises.
What makes certain intersections consistently deadly?
Not all dangerous intersections share the same profile. Research from the Insurance Institute for Highway Safety and NHTSA’s FARS database identifies several recurring factors across the intersections that generate the highest crash severity.
High-speed approach corridors are the most predictable factor. When a signalized intersection sits on a road where traffic routinely travels at 45 mph or higher, the kinetic energy involved in a red-light violation or a failure-to-yield crash can result in catastrophic injuries. The human body cannot absorb a side-impact collision at highway speeds without serious injury. Intersections at the junction of urban arterials and access roads from high-speed corridors are consistently overrepresented in fatal crash data.
Left-turn movements account for a disproportionate share of intersection fatalities. A driver turning left must clear oncoming traffic, process pedestrian crossing signals, and manage their own vehicle’s exposure window simultaneously. When that judgment fails, the striking vehicle typically hits the turning vehicle at or near the driver’s door. Side-impact crashes at intersections are among the most lethal crash configurations in urban environments.
Large commercial vehicles significantly compound the intersection danger. Trucks require substantially longer stopping distances, have larger blind spots on right-side turns, and generate more severe outcomes when they strike smaller vehicles or pedestrians. Intersections near freight distribution hubs, port access roads, and major commercial corridors are consistently more dangerous than comparable intersections in residential areas.
How does Houston compare to other major US cities for intersection fatalities?
Houston presents one of the most studied cases of urban intersection danger in the country. The city’s combination of high population density, car-dependent infrastructure, and major freight activity produces a crash profile unlike most other American metros.
According to TxDOT crash records, Houston saw 65,931 car accidents in 2023, of which more than 20,000 involved injuries and more than 250 involved fatalities. Three Houston highways rank among the 50 most dangerous roads in the United States according to NHTSA FARS data. I-10 ranks fifth nationally, US-59 ranks 23rd, and US-290 ranks 35th.
The intersection problem in Houston is particularly acute for pedestrians. TxDOT’s 2023 crash records show Houston and Harris County reached a five-year high for crashes involving vehicles and pedestrians, with more than 1,500 incidents. Pedestrian fatalities were 152 in 2022 and 146 in 2023, compared to 100 in 2019. Most of those fatalities occur at intersections.
The legal picture after a fatal or serious injury intersection crash in Houston is complex. Texas uses modified comparative fault rules, meaning that fault is assigned by percentage across all parties involved. When a crash occurs at a known dangerous intersection, questions of government liability for signal timing failures, inadequate sight line clearance, or deferred maintenance can sit alongside driver negligence claims. For families navigating that process, working with a car accident lawyer in Houston who understands Harris County’s specific intersection crash history gives victims the clearest picture of every liability avenue available before any insurer shapes the claim on their own terms.
How do Western New York intersection fatality patterns compare?
The WNY region presents a different crash profile from a city like Houston, but the underlying intersection dynamics share common factors.
Erie County’s fatal crash history reflects the impact of high-speed rural-urban transition corridors, where drivers moving at highway speeds encounter signalized intersections that require rapid deceleration. The Hamburg crash at McKinley Parkway and Quinby Drive, the Tonawanda pedestrian fatality on Delaware Street, and the high-speed pursuit crash near Main Street and Benwood Avenue all reflect crashes where speed and intersection geometry combined with driver impairment or inattention to produce fatal outcomes.
New York State’s urban intersection fatality pattern differs from Texas’s in one important structural way. New York applies a pure comparative fault standard, meaning a victim can recover even if they bear a majority of the fault for a crash, with their recovery reduced proportionally. Texas’s modified comparative fault rule eliminates recovery entirely above a 50 percent threshold of fault. That structural difference alters both settlement dynamics and litigation strategy in fatal intersection cases.
Buffalo’s pedestrian exposure at intersections is also a distinct concern. The city’s grid street layout, combined with a high share of residents who walk or use transit, produces a pedestrian-vehicle conflict rate that differs from Houston’s more sprawling, car-dependent geography. Dense urban grids create more crossings per mile traveled on foot, increasing pedestrian exposure even when individual intersections are not high-speed.
What does the national trend data tell us about reducing intersection fatalities?
NHTSA estimates that fatalities decreased in 35 states and Puerto Rico in 2024, while increases are projected in 14 states and the District of Columbia. That split reflects the uneven distribution of both the problem and the solutions being applied to it.
The interventions with the strongest evidence base for intersection fatality reduction include protected left-turn phases that eliminate the judgment call from left-turn movements, raised pedestrian crossings that reduce vehicle speeds at pedestrian-heavy intersections, and leading pedestrian intervals that give walkers a head start before conflicting vehicle movements begin.
Automated enforcement remains the most contested intervention. Speed cameras and red-light cameras reduce intersection fatalities in the locations where they are deployed. They also generate significant political opposition in most US jurisdictions, including Texas, where legislation restricting automated traffic enforcement has repeatedly limited local governments from deploying the technology even at intersections with documented fatality histories.
The estimated fatality rate for 2024 is 1.20 fatalities per 100 million vehicle miles traveled, down from 1.26 in 2023 and representing the lowest rate since 2019. Progress is happening. It is happening too slowly for the families who lose someone at a dangerous intersection that engineers, traffic planners, and policymakers have known about for years.
What should drivers know about their legal rights after an intersection crash?
The legal process after a serious intersection crash begins with a question that many victims do not initially think to ask. Was this intersection known to be dangerous before my crash? If the answer is yes and the responsible government entity failed to act on that knowledge, a claim against that entity may exist alongside any claim against the driver who caused the collision.
In Texas, claims against state or municipal entities for negligent road design or maintenance require formal written notice within a specific deadline under the Texas Tort Claims Act. For state agencies, that notice must be filed within 180 days of the crash. For some municipal entities, the window can be as short as 45 days. Missing that deadline eliminates the government liability claim entirely, regardless of how strong the evidence of prior knowledge was.
In New York, the notice of claim requirement for municipal defendants under General Municipal Law Section 50-e gives claimants 90 days from the date of the incident to file. Buffalo, Erie County, and the New York State Department of Transportation each operate under that framework when road design or maintenance contributed to an intersection crash.
The intersection crash that kills or seriously injures someone is rarely a random event. Most fatal intersections appear in crash databases years before the crash that gets attention. The data exists. The question is whether it was acted on, and if not, who bears responsibility for that failure.


Leave a Reply